
Docs / 01 Inspect
xray
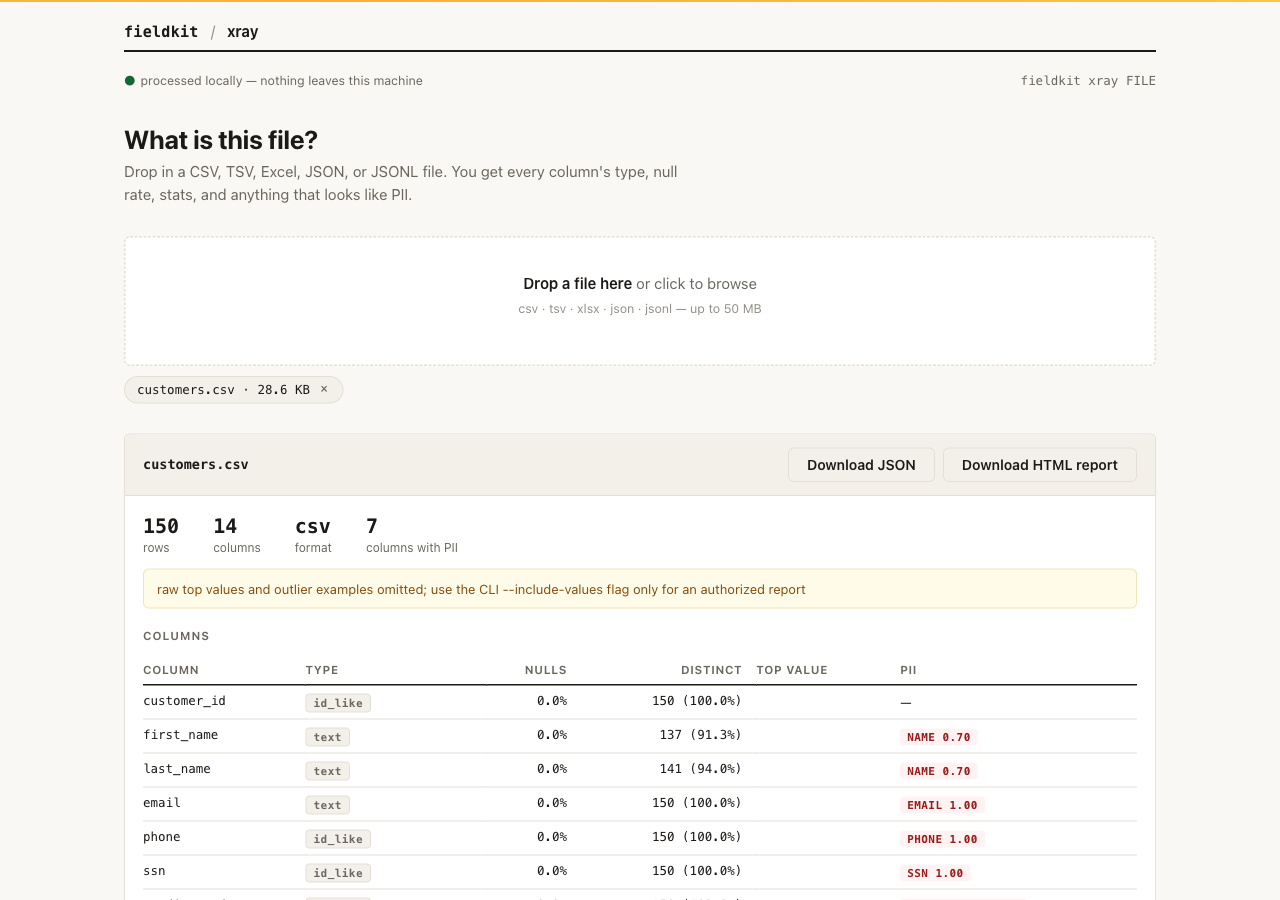
Point xray at a file you have never seen and it tells you what is inside: every column, what type it looks like, how much is missing, what the common values are, and whether anything in there looks like personal data.
When to reach for it Someone hands you a dump and asks "can you work with this?" Run xray first. You get the shape of the data and a PII warning before you paste anything into a notebook, a ticket, or an AI chat.
What it does
xray reads one tabular file and prints a profile: schema, inferred types
(integer, float, date, boolean, categorical, id_like, text), null rates,
distinct counts, summary statistics, and outlier counts per column. Raw top
values and outlier examples are redacted unless you explicitly request a
sensitive CLI report.
Each column also gets PII flags with a confidence score, so
ssn-shaped or email-shaped data stands out immediately.
It works on .csv, .tsv, .xlsx,
.json, and .jsonl files, runs entirely on your
machine, and never sends data anywhere.
Install and run
Already running the fieldkit core? The tool is one
plugin add away:
fieldkit plugin add xray
fieldkit xray customers.csv
Working from the fde-fieldkit repo instead? You need
uv; one uv sync installs
the core and every tool editable:
uv sync
uv run fieldkit xray examples/customers.csv
Every flag
| Flag | Default | What it does |
|---|---|---|
FILE |
required | The data file to profile: .csv, .tsv, .xlsx, .json, or .jsonl. |
--json PATH |
off | Also write the redacted profile as JSON, handy for scripts and agents. |
--html PATH |
off | Also write a printable HTML report, redacted by default. |
--top-k N |
10 | Top values to keep when --include-values is set. Minimum 1. |
--include-values |
off | Include sensitive raw top/outlier values in this one local report. |
--sheet NAME |
first sheet | Which sheet to profile when the file is an Excel workbook. |
--fmt FORMAT |
auto | Force csv, tsv, xlsx, json, or jsonl when the extension or bytes would mislead detection. Parquet is not supported. |
| size limit | 50 MB | Hard MAX_DATASET_BYTES cap on the whole input. Larger files fail with an error that names the limit. |
--help |
Show usage and exit. |
Worked examples
1. First look at a mystery file
The plain run prints the whole profile to your terminal. Note the PII column on the right: xray spotted the email, phone, SSN, card, and IP columns without being told.
uv run fieldkit xray examples/customers.csvcustomers.csv · CSV · 150 × 14
┃ column ┃ type ┃ nulls % ┃ distinct ┃ PII flags ┃
│ customer_id │ id_like │ 0.0% │ 150 (100%) │ — │
│ email │ text │ 0.0% │ 150 (100%) │ EMAIL 1.00 │
│ ssn │ id_like │ 0.0% │ 150 (100%) │ SSN 1.00 │
│ ip_address │ text │ 0.0% │ 150 (100%) │ IP 1.00 │
│ plan │ categorical │ 0.0% │ 3 (2.0%) │ — │
│ mrr │ float │ 0.0% │ 148 (98.7%) │ — │
│ churned │ boolean │ 0.0% │ 2 (1.3%) │ — │
(7 of 14 columns shown; top-value column trimmed for width)2. Make a report you can send
Add --html and you get a self-contained page with the same
profile, ready to attach to a ticket or a status email.
uv run fieldkit xray examples/customers.csv --html profile.htmlcustomers.csv · CSV · 150 × 14
(profile table as above)
wrote profile.html3. Feed the profile to a script
--json writes the machine-readable version alongside the
terminal view. Both output flags can be combined in one run.
uv run fieldkit xray examples/customers.csv --json profile.json --top-k 5customers.csv · CSV · 150 × 14
(profile table; raw values remain omitted unless --include-values is also set)
wrote profile.jsonNext steps
If xray flags PII and you need to share the file, scrub replaces the sensitive values with realistic fakes. If you need demo data with the same shape but none of the real values, that is mimic.